PPM Control Box
The application of portable magnetometers has, as its primary objective, the identification and description of spatial changes in the earth’s field.
The natural time changes described there simply represent noise or interference in the measurements of interest.
The spatial variations or anomalies to be mapped for these applications are those which might occur over several feet or several thousands of feet and are usually caused by an anomalous distribution of magnetic minerals or by iron objects or cultural features which may be of interest.
The anomalies from naturally occurring rocks and minerals are due chiefly to the presence of the most common magnetic mineral, magnetite (Fe Fe*O,),or its related minerals, ulvospinel, titanomagnetite, maghemite, etc. which will collectively be referred to as magnetite, a dark, heavy, hard and’ resistant mineral.
The rust colored very common forms of iron oxide are not usually magnetic and are seldom related to the source of magnetic anomalies. Other magnetic minerals which occur to a far lesser extent are ilmenite, pyrrhotite (with sulphide mineralization), and others of even lesser consequence.
All rocks contain some magnetite from very small fractions of a percent up to several percent, and even several tens of percent in the case of magnetic iron ore deposits.
The distribution of magnetite or certain characteristics of its magnetic properties may be utilized in exploration or mapped for other purposes.
Iron objects in the earth’s magnetic field, whether something buried or intentionally planted for subsequent retrieval, would also create a detectable magnetic anomaly.
Cultural features associated with man’s habitation can frequently be detected through magnetic surveys owing to the contrast in magnetite associated with numerous artificial features such as man-made structures, voids, or the enhanced magnetic effects of baked clays and pottery
Absolute Sensitivity
The absolute sensitivity of the device is in the order of 0.1 nT and its resolution is also of 0.1 nT. This means that it is able to detect any variation of a controlled magnetic field with a value of less than 0.5 nT in a lab environment.
Practical sensitivity
The practical sensitivity is the ability to detect a target generating a given earth magnetic field gradient in the field.
Man-made electrical activity causes observable changes in the value of the local magnetic field. These variations are largest in the vicinity of human activity; near towns, cities and settlements. In the auroral zone (at geomagnetic latitudes greater than about 60 degrees) geomagnetic activity due to currents flowing in the ionosphere can cause background variations of the order of 1000 nT in times of just a few minutes and such activity can go on for hours.
At sub-auroral latitudes and in the “middle of nowhere” well away from human settlements (sea, desert, large forest,…), the true background variations due to the electromagnetic activities of the sun are measured in a few nT per minute. In those environments, the magnetic surveys are very well made with a single magnetometer.
The (natural) diurnal variations of the magnetic field are in the order of 15 nT per day or a few nT per minute or even sometimes per second during short periods or at some specific places.
As a consequence, the sensitivity to detect real targets is reduced by the local environment in spite of the inherent precision of the instrument.
– Single PPM mode : practical target detection sensitivity = 5 nT ( B field in Belgium 48000 nT) or accuracy 0.01%)
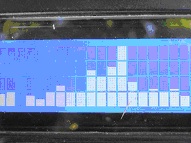
The following two plots, shown in the graph below, were taken in a garden in the vicinity of a human settlement in Belgium using two distinct but synchronized PPM’s whose single sensors were kept at a fixed location and separated by 3 meters for a period of 15 minutes. The readings were repeated at a rate of one per 1.5 seconds.
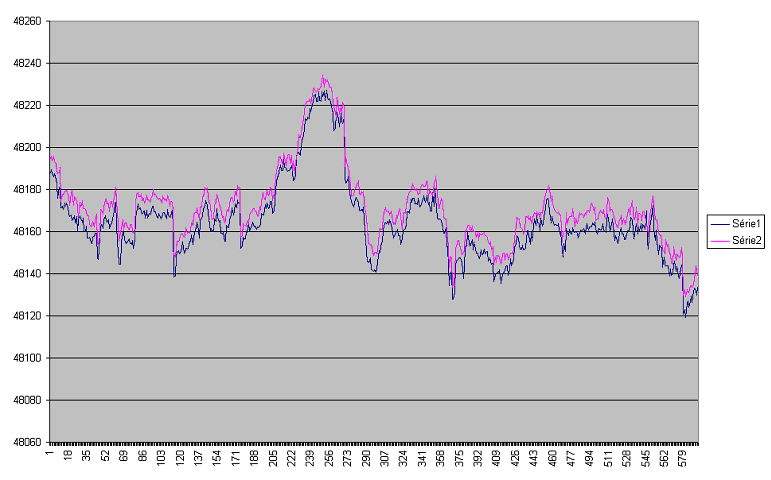
You can see how much the earth’s magnetic field varies simultaneously at the two fixed stations. This proves that they are not induced by the system themselves. The constant difference between the two plots is the value of the gradient of the earth’s magnetic field observed over a separation of 3 meters between the two sensors. The main reasons for the large observed magnetic field variations seen by both magnetometers are the underground currents generated by powerful electrical activities such as DC-powered electric railways that are common in Europe. The electrical railways responsible for those currents may be several kilometers away and this test was made at 1 Km from such a railway. The governmental magnetic field observatory in Belgium is installed in the middle of a large forest and the government has blocked all projects for electrifying the railway network in their region.
The variations are slightly lower in the countryside, far from any house or power line but, in our experience, they are still there. Truly magnetically “quiet’ regions are those many kilometers away from any human activity.
In conclusion, if you want to correctly detect and locate small magnetic anomalies of just a few nT up to a few tens of nT such as those produced by non-magnetic archaeological structure in surveys made in the countryside, in rivers or in lakes, you should use a gradiometer or a differential PPM.
a. Differential configuration : Two PPM , a mobile and one fixed station located in the surrounding and making time-synchronized readings on the two stations . The results are the differences between the total field at the mobile station and the synchronized total field measured at the fixed station. This cancels the effect of the diurnal variations.
b. Gradiometer configuration : Two sensors at fixed distance making synchronized readings, the net result being the difference between the values of B field from the two sensors.
– PPM in Differential Mode : practical target detection sensitivity = 2 nT
Range of detection :
It depends on the total mass of the target and the magnetic susceptibility of its material.
Ferromagnetic materials or alloys (iron, steel, Nickel,…) thus, with high magnetic susceptibility, are easily detected from both their permanent and induced magnetizations.
Order of magnitude : 1kg or less at 1 m , 1 ton at 15 m, 10 tons at 35 m ,
Natural rocks and soil contain Ferrimagnetic material (i.e. made of some amount of magnetite) can also be detected but since their magnetic susceptibility is much lower, they have much less permanent magnetization and the minimum distance of detection is smaller for the same mass of such material.
Typically, dark, more basic igneous rocks possess a higher susceptibility than the acid igneous rocks and the latter, in turn, higher than sedimentary rocks or sands.
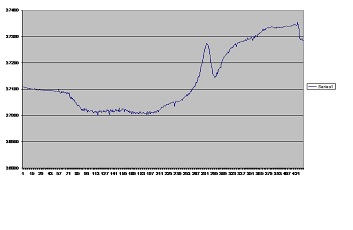
This plot shows a clear dipole generated by the cannons of an old sunken ship close to the Mauritius Island.
This island is essentially volcanic and thus, the bottom of the sea is mostly made of igneous rocks with uneven magnetic characteristics. You can see the slow field gradients generated by the variations of ground specifications along the survey line.
The sudden, dipole-shaped field variation is the indication of a real target which happens to be an old cannon part of a shipwreck.
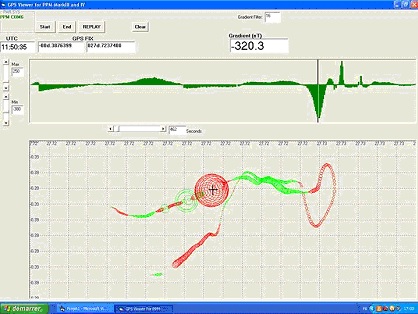
This is a screen dump of corresponding survey track as shown by the PC-based PPM Utility program. The black cross on the XY plot and the vertical black line on the linear plot are the location of the sunken ship.
Magnetic Field range
The 30000 nT to 60000 nT range covers all potential values of the natural geomagnetic field on the planet. It varies depending on the location and it can be adapted on request , changing the C value of the RLC tuning circuit using an automatic tuning process.
See this web site to find the approximate magnetic field in your region.
Cycle period of readings
Adjustable from 0.5 sec. to any longer period. Typically 1 sec. or one reading per second
Typically , during a single reading period of 1 sec., there is 600 ms of sensor magnetization , a delay of 50 ms to let the current cutoff oscillations dying out and 250 ms of frequency measurements (all of these timings are adjustable ) .
During 250 ms , many individual frequency measurements are performed, they should be almost identical if the tuning settings and gain are correct.
Each of the three timings can be set. It is thus possible to adapt the cycles of measurement to the type of liquid contained in the bottles of the sensor. Isopropyl Alcohol gives the highest results in mV of signal generated by the sensor.
Autonomy of power supply
The device is normally powered from a 12 V battery but it can go up to 24 V if necessary.
Usually a gel-cell battery of 5 Ah is used, it weights around 1.7 kg .
It supplies power to the PPM for around 2 hours of constant survey work at one reading per second.
A gel-cell battery of 7 Ah weighting 2.5 kg gives an autonomy of around 3 hours.
With a battery of 12 V , the sensor coils are polarized with a current of 1.5 Amp.
Audible and visual alarms
These alarms can be different on the PPM and PPM Utility
Magnetic anomaly detection (field gradient )
The PPM works by detecting fast changes between two consecutive measurements of the geomagnetic field. It measures the difference between value of the current measurement and the previous one and we call it a ‘Field Gradient’ . The time interval between measurements being constant, if the absolute value of the field gradient is greater than an adjustable threshold , it generates an audible and visual alarm on the PPM and/or the PPM Utility if connected.
Standard deviation Alarm
Used to check the quality of the readings.
AT each reading period, during 250 msec, a large series of individual frequency measurements are performed and their standard deviation (Stdev : mathematical value used in statistics ) is calculated . It gives the amount and number of variations among a set of values.
A small Stdev value (close to 0 nT) indicates all frequencies had almost identical measures assuming that the final, averaged measurement will be of highest quality and reliability. A higher deviation (e.g. more than 20 nT) indicates that there were many variations of frequency evaluations among this series of values . The averaged value is supposed to be unreliable as the (adjustable) threshold of 20 is reached.
False information will not be displayed on the PPM or PPM Utility. Only one alarm will be. False values , however, will be recorded on the SD card and the PC.
Signal Amplitude alarm
Also used to check the quality of the readings.
Measuring the amplitude of the decaying signal still remaining at the end of the cycle of each net reading.
If it is low ( 40 mV) and below the adjustable threshold , the measurement is considered to be unreliable and removed.
The standard deviation also tends to rise in this case.
Unreliable readings are not displayed on the PPM or PPM Utility. there is only the aural and visual alarm indications but these values are still be recorded on the SD card and the PC.
Note that the signal amplitude in a volcanic environment tends to be much lower than in non-volcanic environment and that we can always keep the sensor higher from the ground to improve measurements.
Low battery voltage alarm
If it is low ( 10 V, adjustable), an alarm designed to protect the battery (and the control electronic circuit) is displayed.
Under a measured value of 9V , the PPM does not work at all.
Circuit Protection
in case of detection of a Short-circuit of the sensor (protection of MOSFET), the polarization process is blocked to protect the power stage of the system (no specific alarm in this case ) . It is necessary to often check the connections and the sealing of underwater sensors .
System parameter setting
Fifteen parameters are accessible from the PPM display or the PC.
Most of those are set at factory.
In practice, once set , only the grid file name , the tuning and gain are occasionally modified.
The setting is stored on the SD card in the ‘GlobalP.txt’ file
Storing survey data
Data Storage on the SD card of the PPM in real time .
These data files can later be transferred from the PPM to the PC by USB or Bluetooth or by physical transfer of the SD card to the PC
There is a simultaneous data storage on the PC in real time if the PPM has a PC connection and is connected to the latter .
See below for details on data files .
Tuning
Finding the approximate frequency of the local magnetic field and configuration of the device (see Principle of operation). This operation is fully automatic , it is a two-phase measurement and control .
Duration of tuning : 1 minute .
The operation begins by measuring the local magnetic field without tuning the sensor : 3 sets of FFT measurements are made that are displayed , they must have about the same value.
If acknowledged by the operator, the PPM then calculates and tests the value of 8 tuning capacitor values on either side of the value calculated in the first phase. It selects the one that has the best signal maplitude in millivolts and the lowest standard deviation. This tuning capacitance is then set and it is recorded on the SD card in the GLOBAL_P.TXT file.
The details of the tuning process are also recorded in a log file.
PPM display
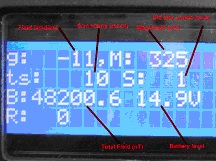
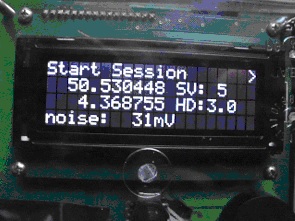
The sun-readable color graphic LCD display is organized for most textual display as 4 lines of 20 characters.
5 buttons move through the menus, the center button (OK) accepts the proposed menu.
The 3 main menus are:
- Survey control
- file control
- Parameter Setting among which are the tuning and the type of survey mode.
The display can also be made on the Windows-based PC via a PC connection . (See PPM Utility description)
During a PC connection, the LCD display is cut off to spare battery power.
SD card
It is contained in a reader plug contained inside the watertight case of the PPM
The PPM can not run in autonomous mode without this card but it can do so if connected to the PC.
The SD card must be selected of good quality type. Some malfunctions have been observed related to defective or non-compliant SD cards .
It contains the configuration files ‘GLOBAL_P.TXT’ and records survey data in named Grid files
Configuration file (GLOBAL_P.TXT)
This file is automatically created with default values if it does not appear on the SD card . The system parameters can then be modified with the keys and screen of the PPM or through the PPM PPM Utility. The file on the SD card is then updated.
During each power up, the PPM will load this parameter file.
The ‘GlobalP.txt’ file contains twenty lines written in a very rigorous syntax. It is available in Word Pad ( do not change) . Most of the parameters are also readable on the screen of the PPM
Survey Data File management
These files are written in ASCII-CODED text format and are readable in Word Pad, Excel as well as with PPM Utility
The files are always stored on the SD card of the PPM , even when there is a PPM to PC connection
File names are 8 characters. The first two are written by the program and is the type of file. The following four characters are figures and are defined by the user (hours and minutes). The last two characters are numbers and are automatically incremented at each launch “session” of the PPM . They are also modifiable .
At the beginning of each data file , a comment line is recorded with the current parameter settings .
Then, follow the lines of measurements, one per second , in principle , with the values of measurements: time stamp, total magnetic field, magnetic field gradient (difference with the previous measurement ) , standard deviation, signal magnitude in mV, battery voltage .
If you have the GPS option, there are also : UTC, latitude , longitude , number of satellites in view , GPS signal quality (HDOP)
All values , including those defined as unreliable , are stored on the SD card and the file on the PC
If a Sonar is connected to the PC via serial or Blue tooth , the depth is also included in the lines.
The display on PPM or on PPM Utility does not show incorrect values . They are detected by the thresholds in mV and standard deviation programmed in the PPM or in the PPM Utility.
Example ( PPM with GPS )
Longitude , latitude , UTC, total magnetic field , standard deviation, mV, battery voltage , number of sattelites , precision satellite, altitude/depth
GDxxxxyy.txt file
GPS_SESSION : 20/4/2011-11 : 30:42 , GD042010 , 90ms , 600ms , 138x , 37298nT , 1000mS
$ 57.7317755 20.3898747 113047 37327.2 7.3 67 11.4 11 0.8 282
$ 57.7317607 20.3898715 113048 37329.9 14.3 30 11.4 11 0.8 287
$ 57.7317466 20.3898679 113049 37325.5 9.0 57 11.4 11 0.8 289
Each measurement session is recorded with a line of parameter settings followed by the data lines (of ten space-separated data elements) in one row , typically every second.
On the PC, reading these files in *. Txt, can be done with Excel or Word Pad .
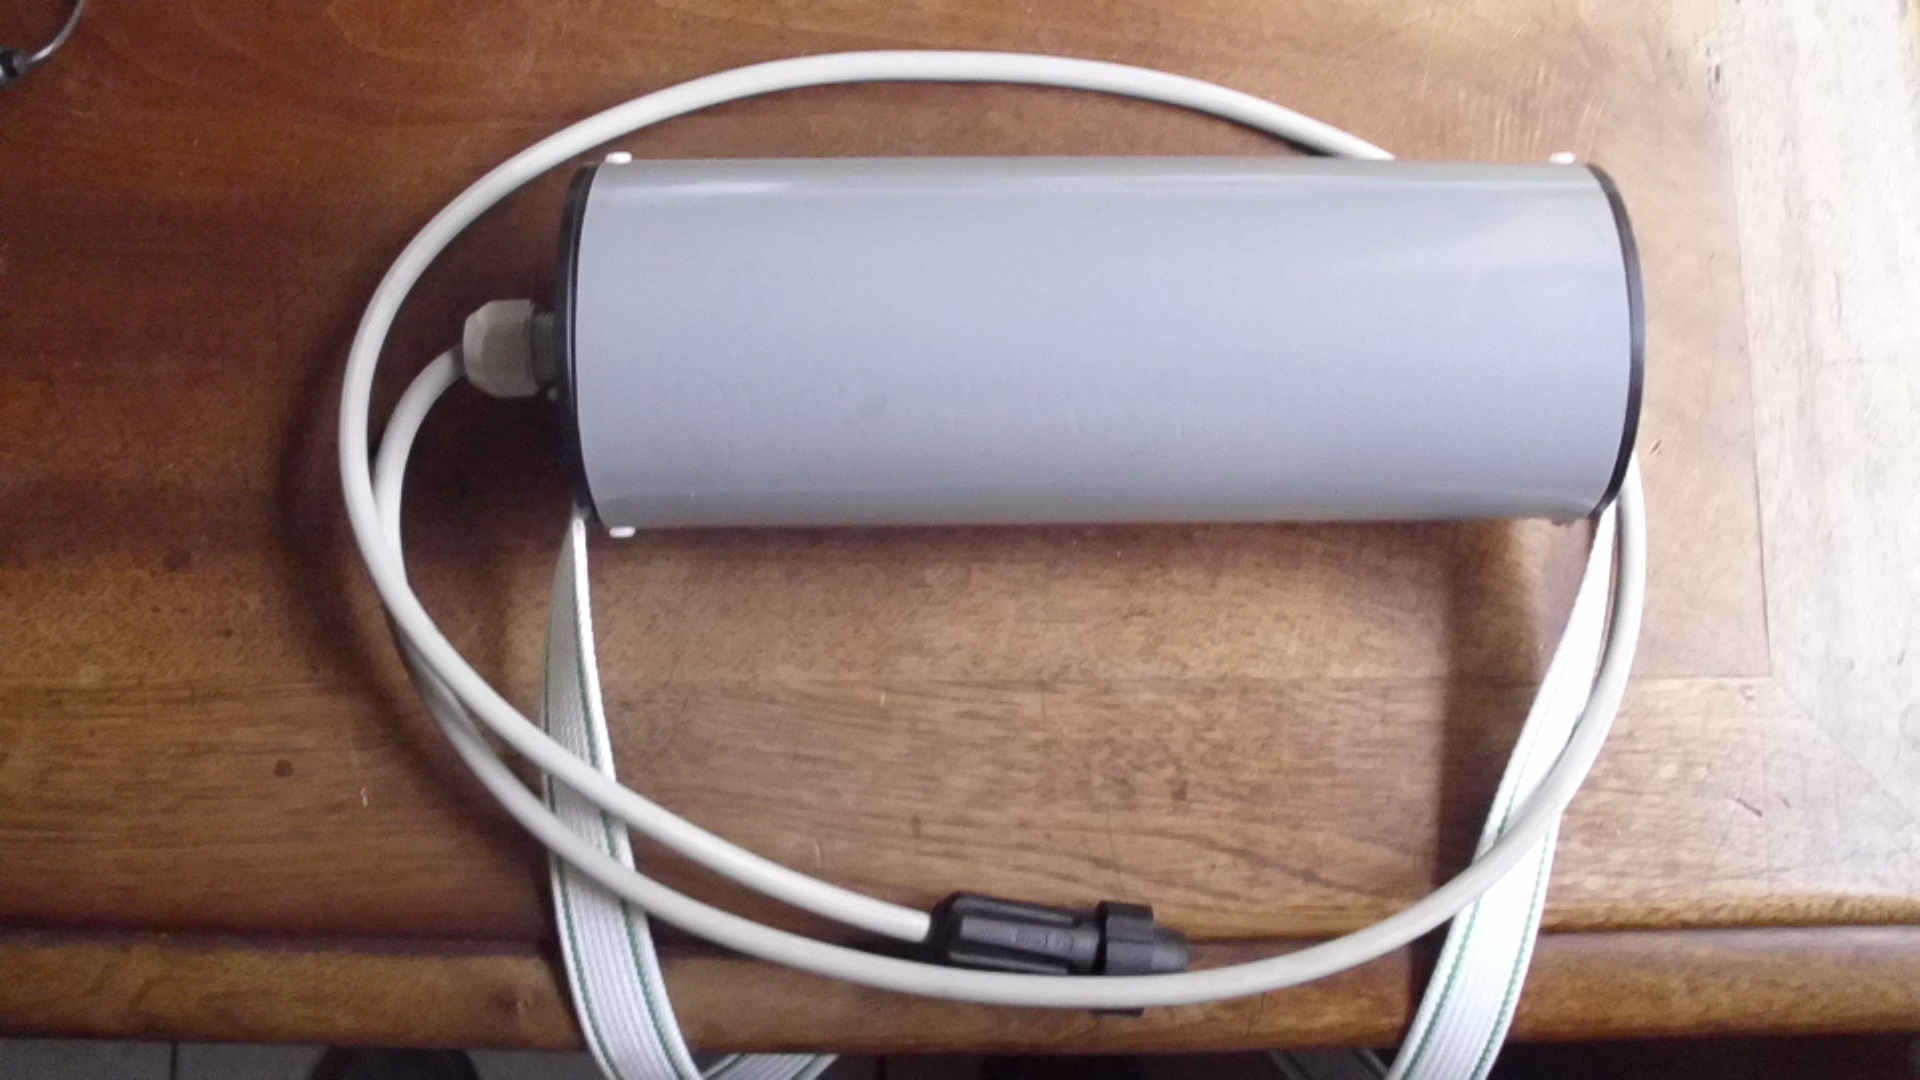
Cabling
– Sensor cable : length : 1.5 m , 2 unshielded conductors . It passes through a connector in the control box and through a cable gland in the sensor. This makes it easy to disconnect the sensor and its cable from the box for storage and transport.
- Battery Cable : 1 m , it passes through a cable gland in the control box
The battery is generally carried on a belt or shoulder strap.
Dimension , Weight
Case: 15 x 15 x 9 cm, 0.7 kg
Probe : 22 cm, 1.2 kg
Whole assembly : 3.6 kg with 12 V 5 Ah battery
ASSOCIATED SOFTWARE
Windows-based software : PPM Utility, used in real time prospection ( typically marine prospection ) and Batch (post prospecting at home)
See PPM Software Utility
Note that it is possible to connect the PPM to the PC but also a sonar and record on PC files the data from the PPM but also the depth from the sonar .
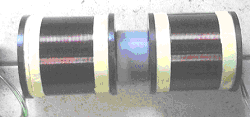
SENSOR(s)
The sensor container contains two coils , with windings inverted in order to cancel the “ambient noise” from the measured signal .
The coils are made of aluminum (for underground survey sensor) or copper (for underwater survey) . The copper coils are more efficient providing better signal magnitude ( see Principle of operation). They are mostly used in marine exploration where the targets are generally more distant than ground survey. The sensor cable is also much longer in marine work generating more voltage loss.
There is a plastic bottle inserted in each coil.
They contain the proton-rich fluid, the standard fluid being used from factory is the Isopropyl Alcohol but one can also use barbecue lighting alcohol to refill if necessary.
FIRMWARE UPDATE/UPGRADE OF PPM
The possible updates will be sent by email to the users if bug corrections or important upgrades are available.
A file ( compiled language of the Micro controller) needs to be transferred from the PC to the SD card of the PPM and then be loaded into the flash memory of the microprocessor. This transfer is done by a special key combination at power up.
The PPM Utility is not used for this operation.
The software version is being displayed on the PPM screen when it is turned on .
PPM UTILITY SOFTWARE UPDATE
See Contacts Tab