PostProcessing Program (PPM Utility running in Batch mode)
It is able to completely take care of all the post-processing tasks required to interpret survey results.
It replaces and very much extends the functions given earlier by both the GNUPLOT-based process and the SURFER program.
The license of running this program in Batch mode is included in all the package configurations and options.
- Replaying Grid files
The survey files captured on the SD card of the PPM can be moved to the PC and these sessions can then be replayed in batch mode in order to make detailed studies of the results before generating the color-coded grid files.
Underground survey example
Underwater survey example
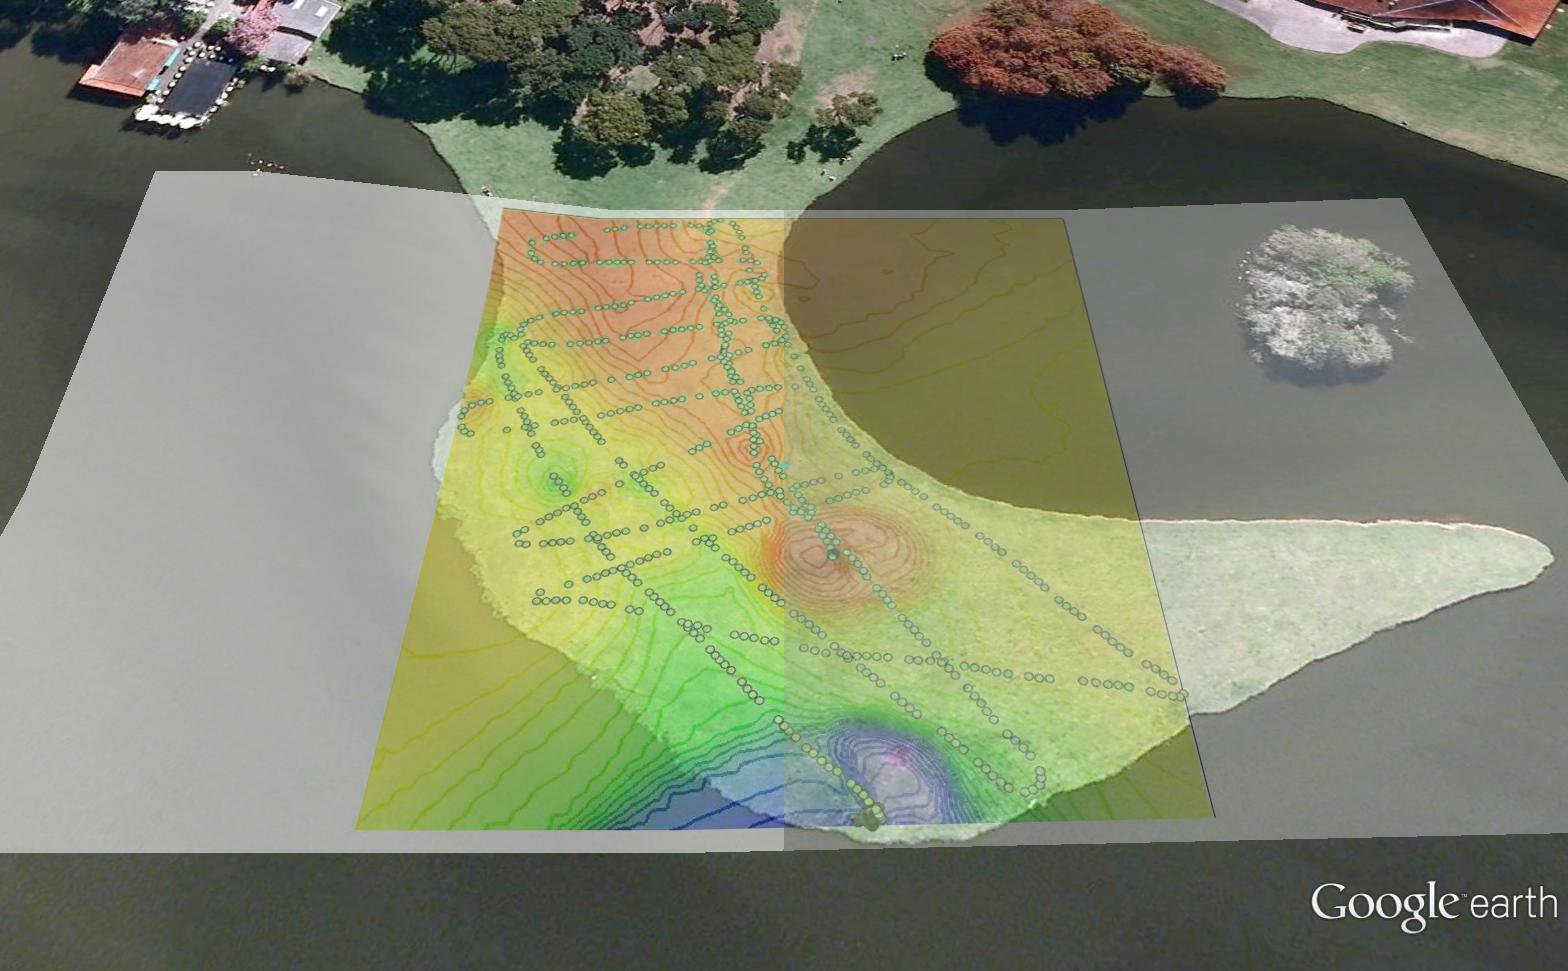
same survey with georeferencing
This is a GPS-based survey displayed in Google Earth from a grid file
generated by our post-processing program
and converted to a KML file .
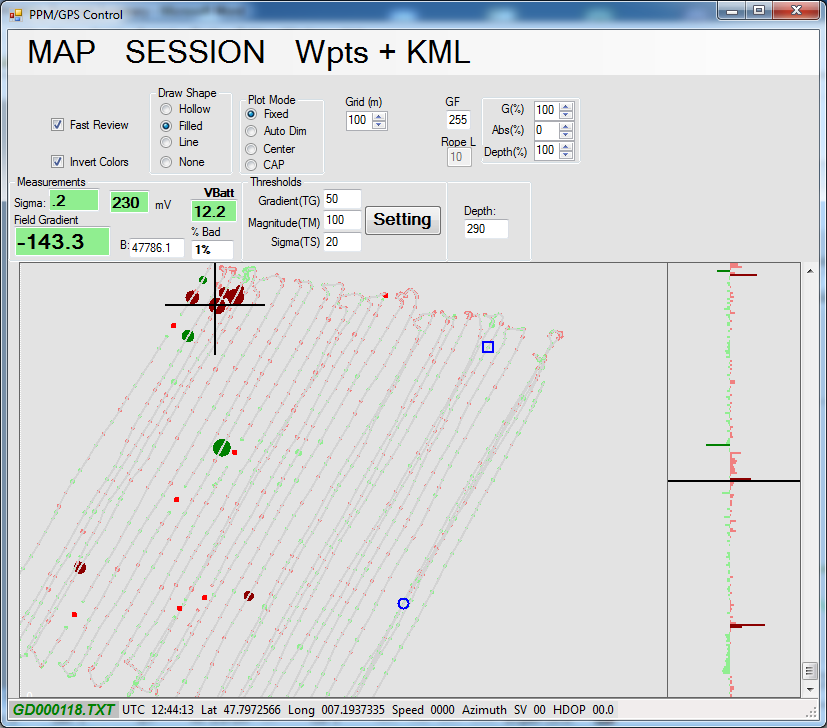
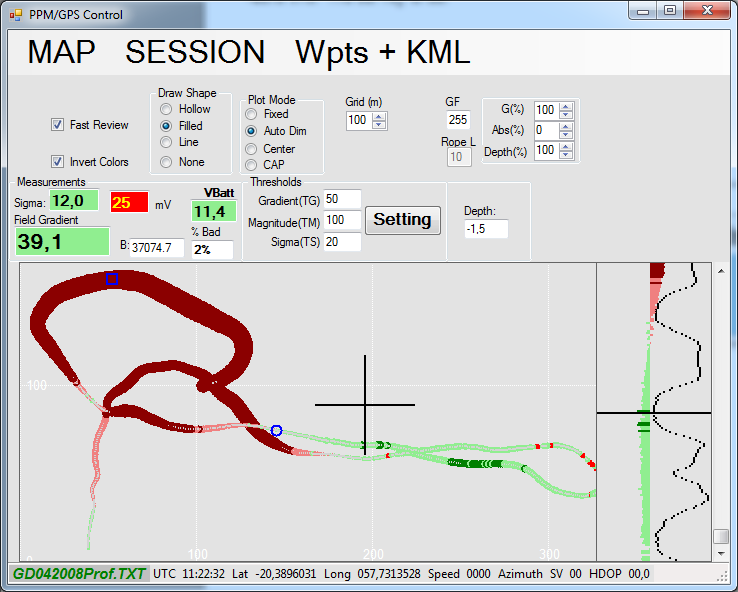
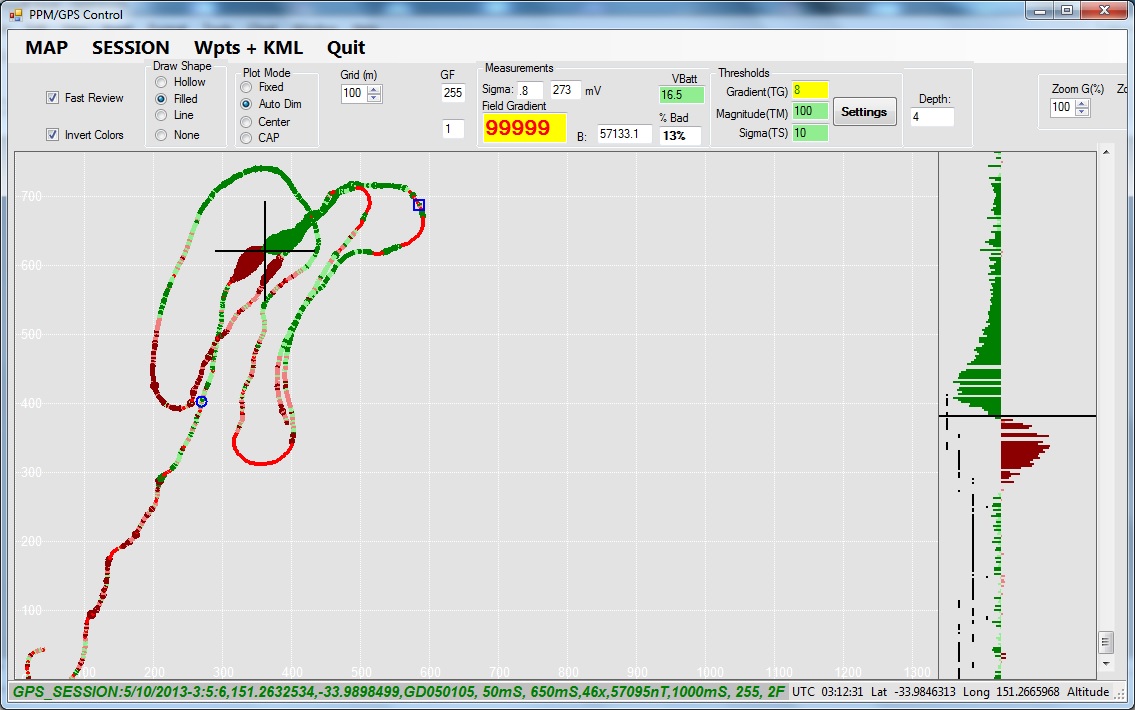
These pictures show two underwater surveys as displayed on the PC with the PPM Utility program (two different generations of the same program!). These surveys cover an area of several square Kms in Mauritius Island.
There are two main plot area:
1. A linear bar chart showing the variations of field gradient expressed in nT. You can see the dipoles generated by shipwreck targets.
2. An XYZ plot showing the GPS track and the corresponding field gradient variations displayed as variable size blobs, green for positive gradients, red for negative gradients. The grid gives some idea of the scale.
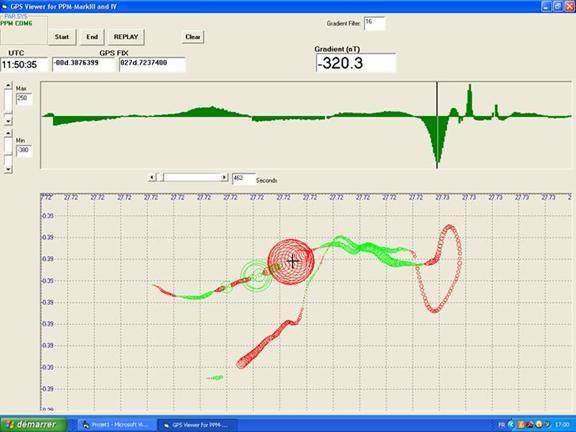
The grid lines on the following plot are set to a distance of 100 meters
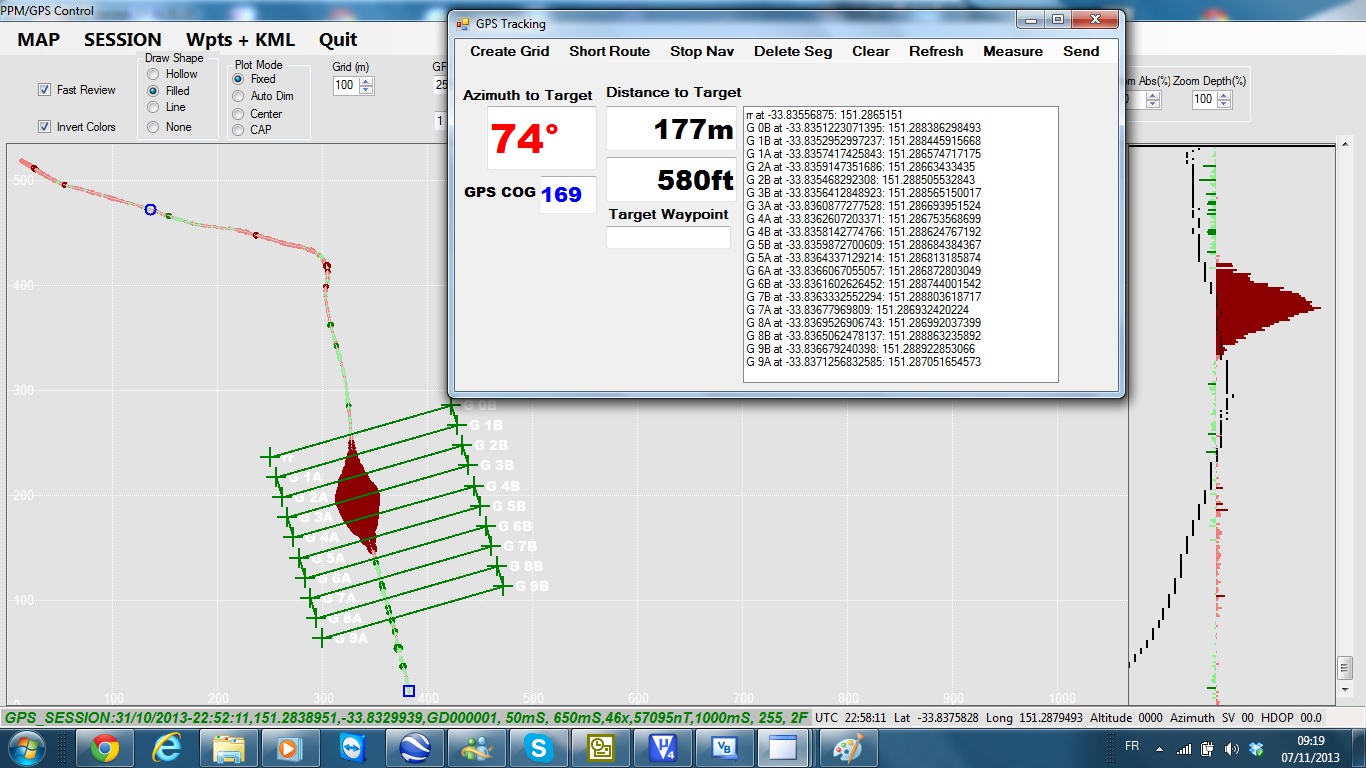
Preparing the GPS-controlled navigation for future survey sessions
While studying survey sessions made at random at sea (so-called ‘linear surveys’), some potential targets can be detected.
Thus, it is then necessary to more precisely locate the wreck by running a full grid-shaped session over that area.
The PPM Utility gives the operator the function to generate a full grid track made of parallel survey lines ended by GPS waypoints.
These are then saved in a waypoint file to be used as navigation reference during a further real-time survey session (See real-time functions)
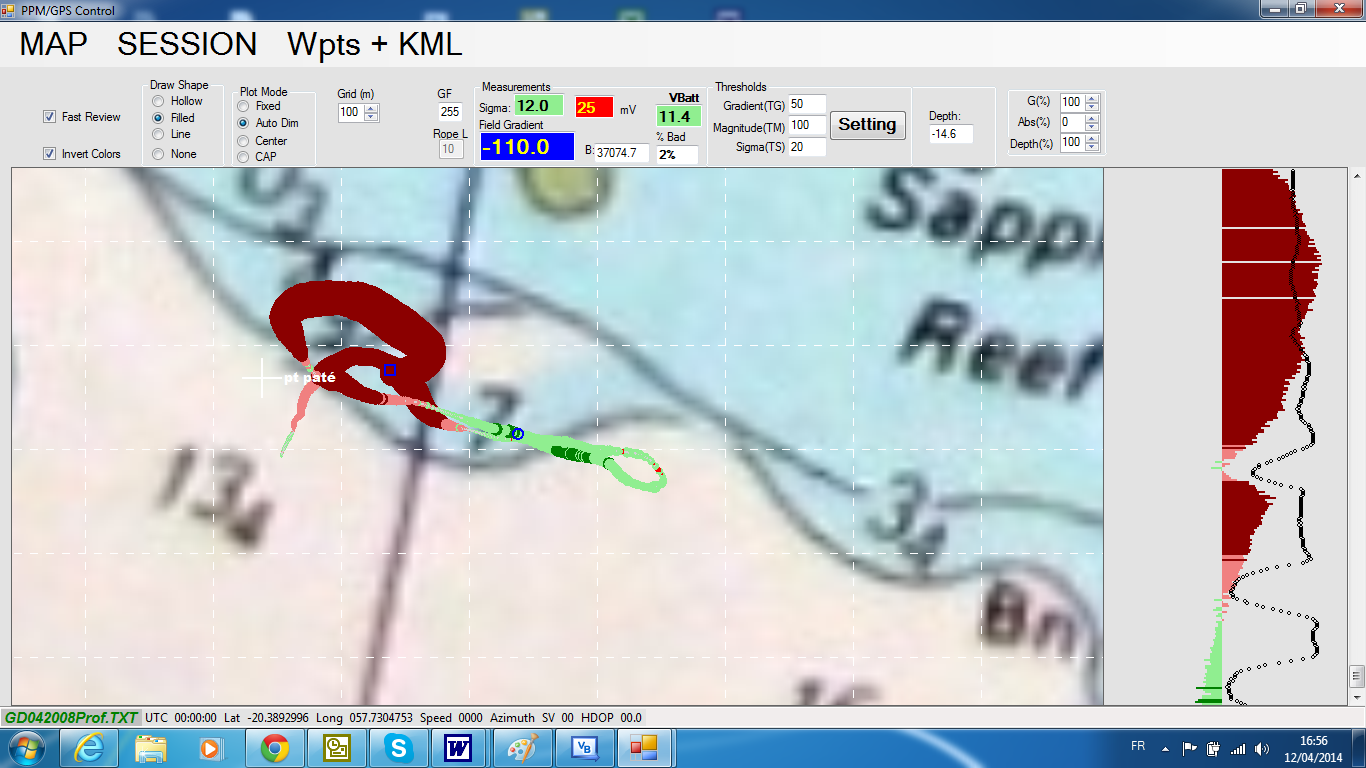
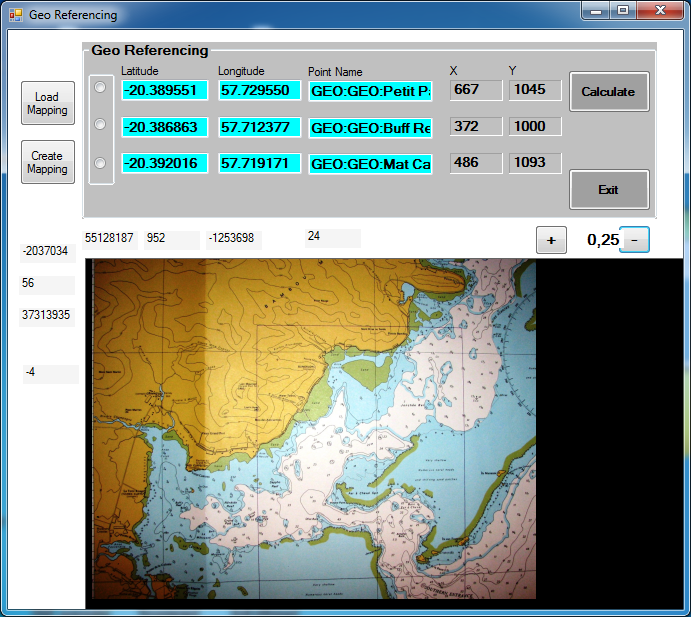
- Geo-referencing geographical maps.
Any type of graphic file, scanned map or even screen dumps can be used as reference to georeference GPS-based survey files.
The only requirement is to know three GPS fixes corresponding to equivalent locations pointed on the map with the mouse cursor.
When the process is terminated, there is a small data file linked to the map (the graphic file).
These two files can then be used as background image during further real-time survey sessions or session replay of this region.
This example shows the reefs around Mauritius Island
Batch processing
- For sessions files captured in multiline mode in differential configuration (with a base and a mobile stations), it calculates and records the field gradient corrections to eliminate the daily field variations.
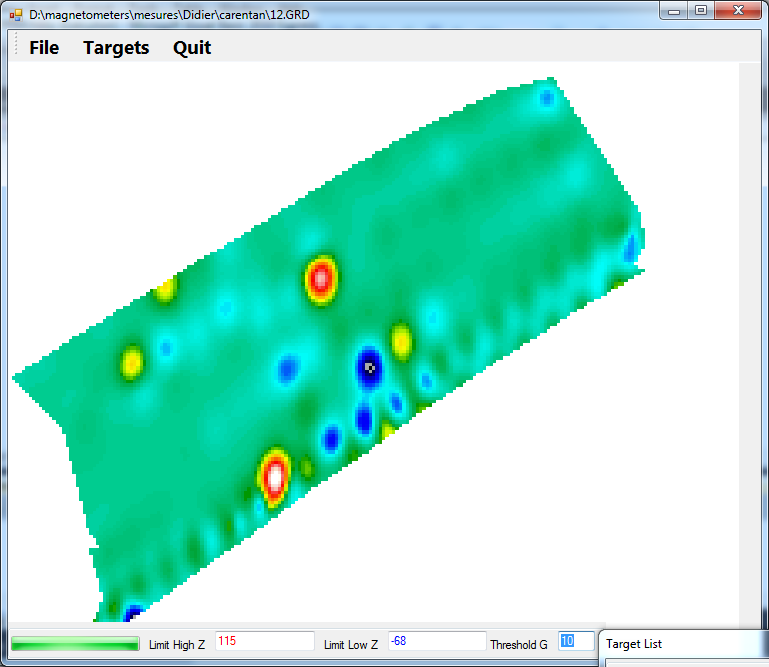
- Sessions files may be captured in multiline mode covering any type of convex polygonal survey area.
- For sessions files captured in multiline mode without GPS in real-time, it calculates the georeferencing from three GPS reference points of the survey area and converts all the relative coordinates into GPS coordinates.
This is an example of a polygonal grid file captured in multiline mode and georeferenced.
- For session files captured in GPS mode with a base station recording the fixed GPS data using any NMEA capture program (even any terminal emulator), it converts the NMEA data stream into MarkVII-specific format and it calculates and records the GPS-corrected results.
- For session files captured in GPS mode in differential configuration (with a base and a mobile stations), it calculates and records the GPS and field gradient corrections to eliminate the daily field variations and most of the GPS inaccuracies.
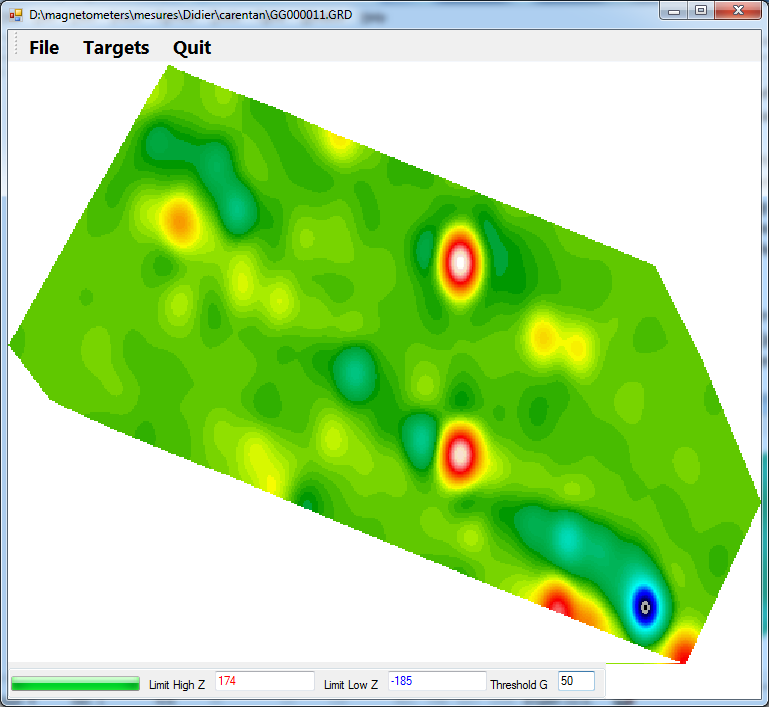
- For any finalized and corrected grid-shaped survey file, it interpolates the valid measurement points and generates color-scaled grid maps (previously generated by SURFER). This can be generated from survey files with relative coordinates (base 0,0) or WGS84 or UTM coordinates.
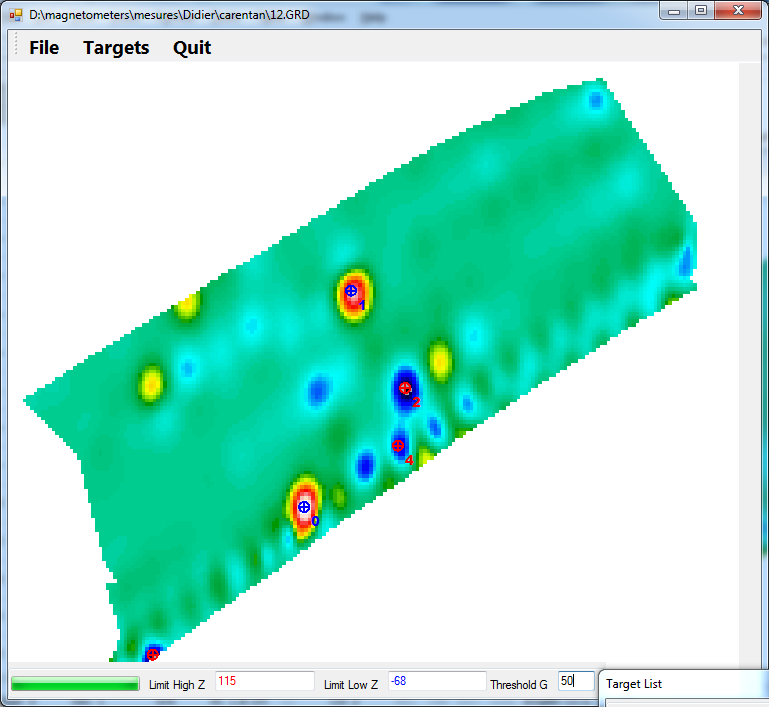
This is a grid made from a small 40x40m square of a large GPS-based survey looking for UXO in Normandy.
It has been produced and displayed with the PPM Utility program.
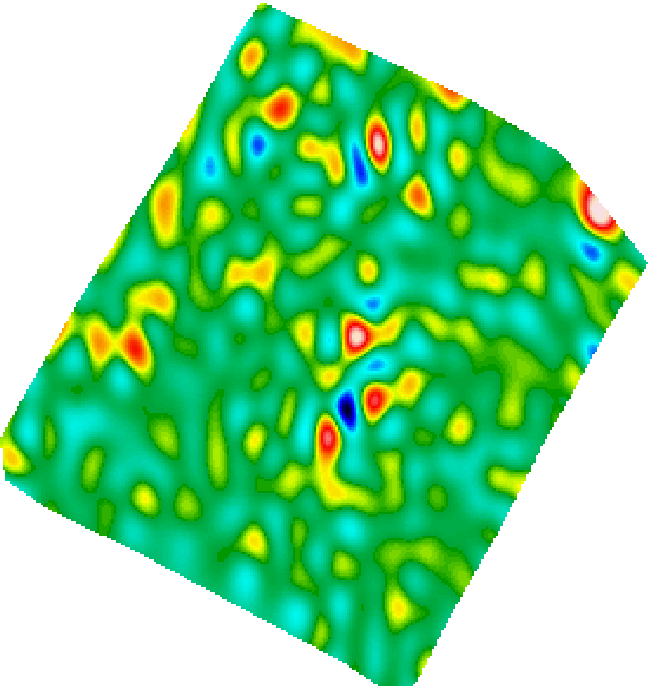
- Automatically detects, marks and lists potential targets from a grid map based on a given minimum field gradient value.
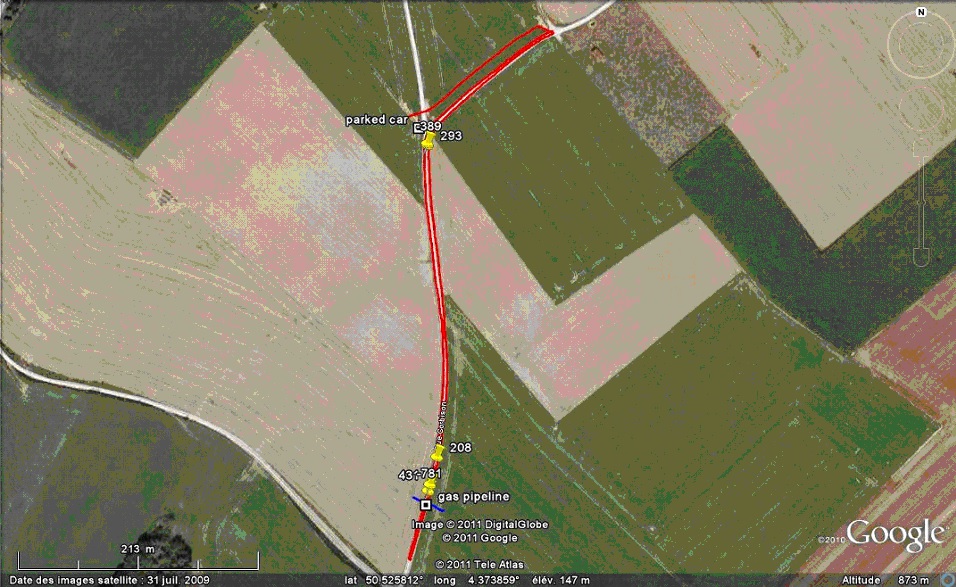
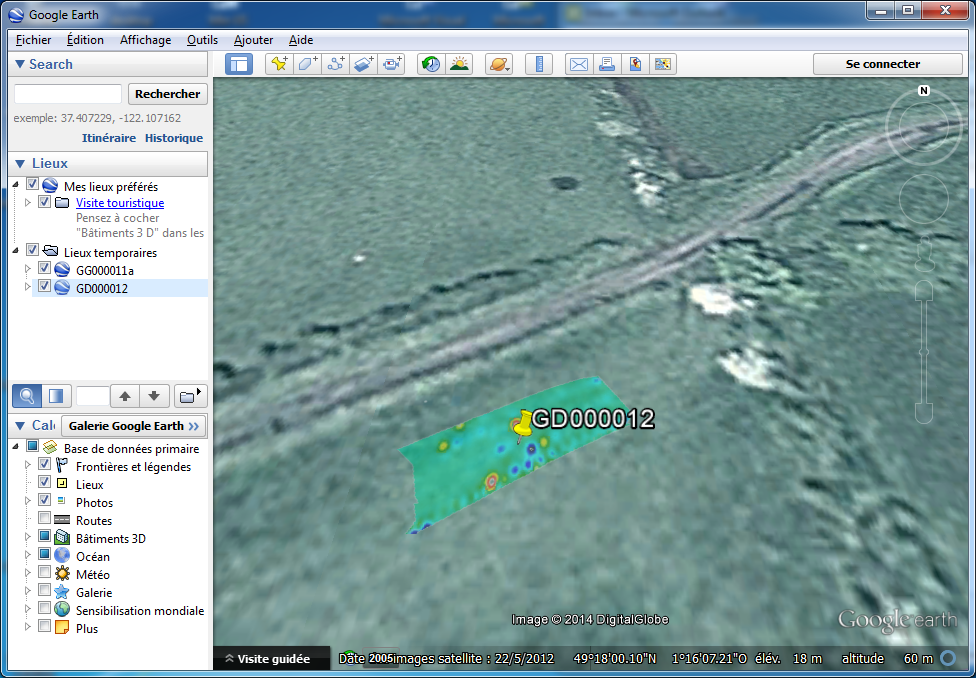
- Generates KML files from Grid files.
This is an example of a grid file captured in GPS mode during an UXO session in the Normandy region and displayed by Goggle Earth
This is a KML file generated by the PPM during a test survey along a dirt road in the country and plotted by Google Earth.